

Given the important impact that budgets have on companies, however, creating a more accurate and reliable budget—and communicating it to stakeholders such as the board of directors—would provide added value to the process. Two additional pieces could be added to the budget package to improve the quality of the budget numbers and to help explain the rationale behind the numbers: (1) organic and inorganic growth and (2) capacity costs.
ORGANIC AND INORGANIC GROWTH
The corporate conglomerate I work for has experienced the benefits of these additions to the budget. One of the companies we own is in its growth phase. Each year new outlets are opened. Investment in every new outlet goes through the capital expenditure process. Since we have always been monitoring performance of every single outlet through management information system (MIS) reporting, we have a clear understanding of the performance of inorganic and organic business as far as the income statement is concerned. But when return on capital employed (ROCE) wasn’t growing proportionate to business growth, we felt the need to go into the balance sheet analysis beyond the entity level, leading to the enhancement of including organic and inorganic growth.
In many budgets, the explanation for growth in revenue often contains a small note on organic and inorganic growth. In most cases, inorganic growth requires additional investment that’s expected to improve shareholder wealth in the long run. Every such major investment decision is backed by a complete and detailed study of key financial metrics such as ROCE, return on equity (ROE), internal rate of return (IRR), net present value (NPV), and so forth. Such investments are prominently reflected in long-term business plans, and aptly so.
An interesting question is if the annual budgets consider the impact of these long-term investment decisions—with a complete set of financials and metrics—and identify the impact separately in the actual vs. budget variance analysis.
Table 1 shows a typical presentation of the explanation of revenue and bottom-line growth broken down into organic and inorganic businesses. In the income statement budget in Table 1, the P&L targets of organic and inorganic growth are clear. Inorganic business is expected to exceed organic business in terms of gross profit (41.3% vs. 35%) and net income margins (21.3% vs. 16.8%).
But is the inorganic business expected to increase shareholder wealth or erode it during the year 2018? Let’s see if the conventional balance sheet budget (see Table 2) answers this question.
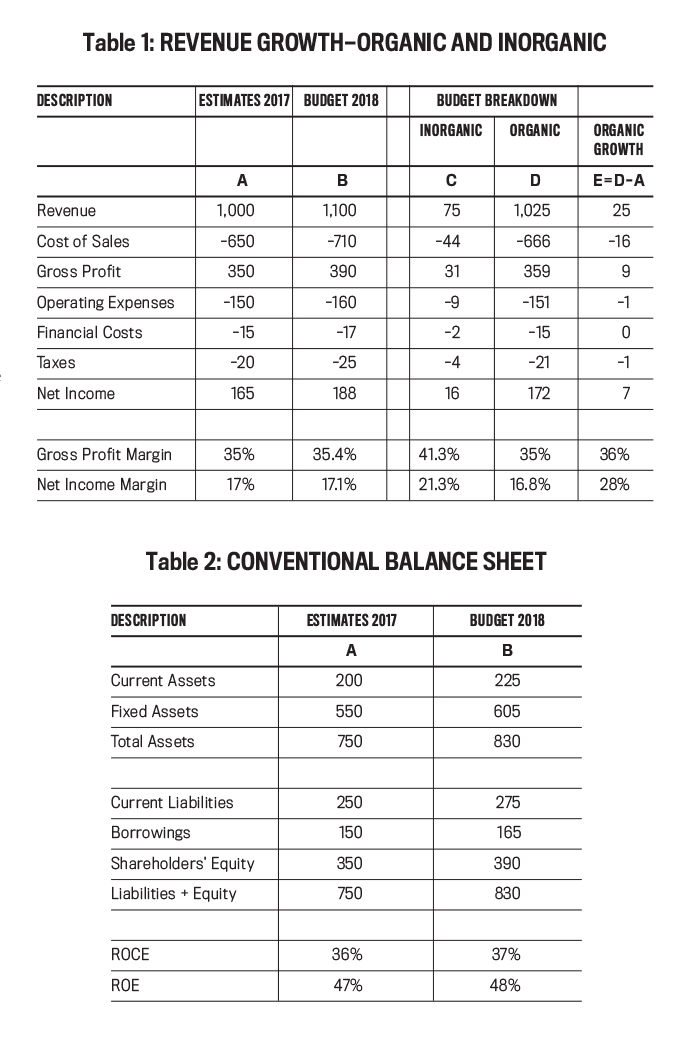
A first look at the financial metrics would make everyone happy, particularly the head of business development. ROCE and ROE are expected to improve in 2018, and the immediate reason would likely be that inorganic business is improving the gross profit and net income margins. But is that an accurate assessment?
If we break down the balance sheet budget into Organic and Inorganic sections, as shown in Table 3, we can see that both the ROCE and ROE of inorganic business for 2018 are expected to be lower than 2017. In spite of this, the company’s total ROCE and ROE are expected to increase in 2018 only because of the expected higher ROCE and ROE of the organic business.

Thus, the incremental balance sheet along with the ROCE and ROE help explain the impact of inorganic business decisions on the shareholder wealth for the medium term. It could also help with monitoring the implementation of the long-term business plan. For example, the projected cash flows from the feasibility study of a particular project could be checked against the annual budget to see if the annual plan is in adherence with the long-term plan. If a new investment is showing underperformance year after year (as per the cumulative actual performance plus the current annual budget), it’s probable that it won’t meet its life-cycle plan.
With the help of an effective enterprise resource planning (ERP) system (the conglomerate I work for uses SAP), it’s quite easy to obtain balance sheets by profit centers (which are really investment centers) and monitor actual vs. budgeted numbers.
CAPACITY COSTS
A few years ago, my company invested in a factory that manufactures plastic products. That was also the time when we implemented SAP across all companies of our group. The factory was operating well under capacity. The finance head rightly pointed out that if we priced in the excess capacity, we would be unable to compete in the market. That was when we hit on the idea of separating excess capacity costs in SAP’s cost center planning (SAP refers to “budgeting” as “planning”). Thus, production overheads excluded excess capacity costs.
Capacity costs generally aren’t identified in the income statement budget. Such costs are usually associated with cost of sales but could equally have a high impact on selling and distribution costs. Such fixed costs could include depreciation of production assets; direct labor; project management staff in a project business; and rent and operations costs—such as for running retail outlets like restaurants—along with the accompanying labor costs.
The issue with conventional budgets is that cost of sales is presumed to be fully variable, and management generally expects gross profit margins to remain stable. While this may be true in most cases, cost of sales consists of fixed costs that could impact gross profit margins due to capacity utilization.
By including capacity costs in the budget, it’s possible to better capture and identify their impact. Let’s look at an example. To simplify things, the example assumes that operating expenses are fully fixed while cost of sales has variable and fixed components.
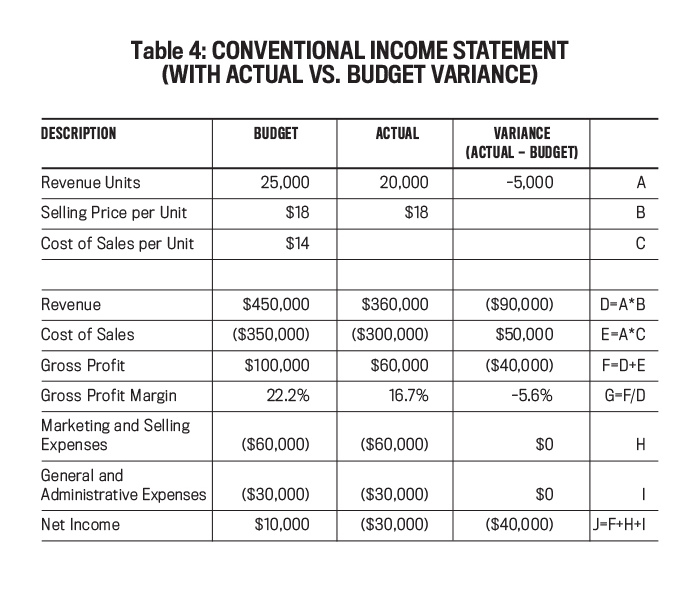
Table 4 shows the conventional income statement budget as well as the actual vs. budget variances. For the sake of simplicity, all actual numbers are kept the same except for the revenue units. As you can see in the variance column, there’s a gross profit variance of -$40,000 and a gross profit margin variance of -5.6%. But that doesn’t answer some key questions:
- How much of this variance is due to common factors like selling price variance or cost of sales variance?
- How much of it is due to lower capacity utilization?
The issue with the conventional budget is that the cost of sales per unit is assumed to be fully variable. Significant variances in the cost of sales can be observed when revenue units exceed or fall below budget. As the company begins to search for explanations for the variance, one obvious reason is capacity utilization and the resultant under- or over-absorption of fixed costs, which isn’t reflected in the conventional budget.
The budget can be enhanced to better explain variances by including additional items in the budget, such as: optimum capacity (in units), capacity utilization percentage, fixed cost of sales, fixed cost of sales per unit, variable cost of sales, variable cost of sales per unit, unutilized capacity cost, gross profit margin before unutilized capacity costs (the normal gross profit margin that the business would expect to achieve at optimum capacity utilization), and gross profit margin of unutilized capacity costs (the impact of unutilized capacity costs on the total gross profit margin).
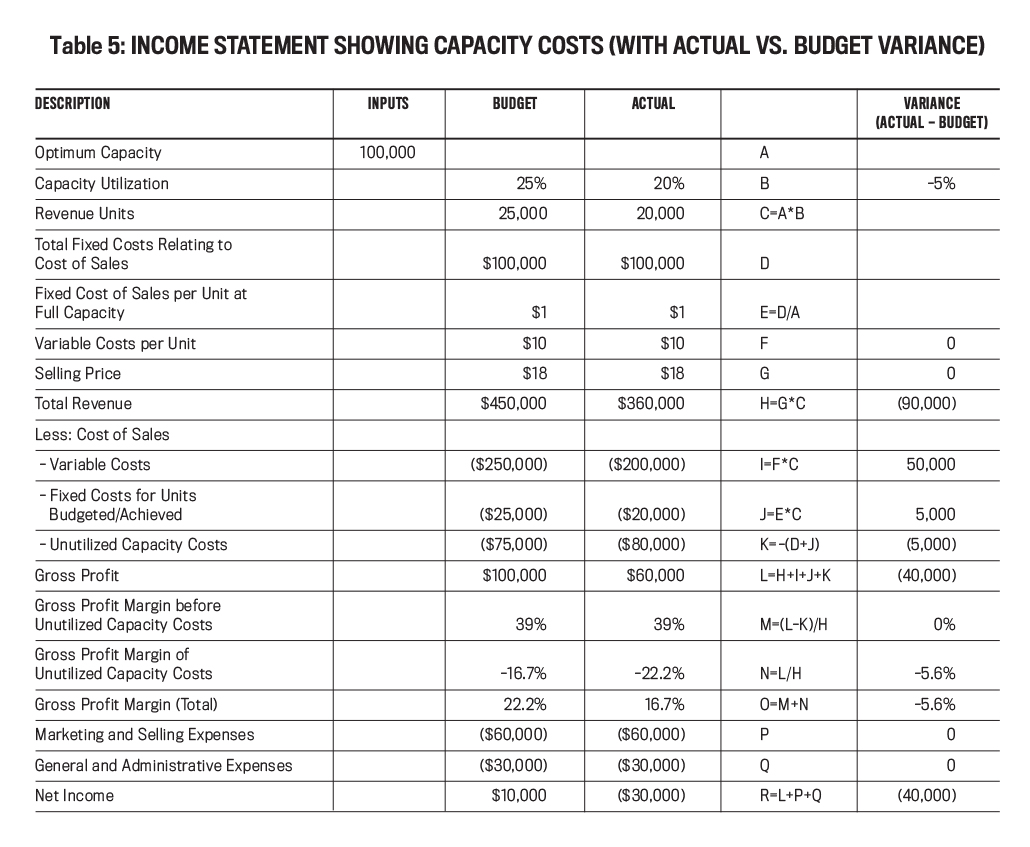
Table 5 shows the enhanced budget (with variances). Its main features are:
- It recognizes the capacity utilization factor and forecasts the percentage of capacity utilization.
- Fixed costs relating to cost of sales are now allocated according to capacity utilization. In Table 5, for example, the capacity utilization is 25% related to a budgeted cost of sales of $25,000.
- Fixed costs corresponding to unutilized capacity are identified as “unutilized capacity costs.” In this case, unutilized capacity costs are $75,000, which is equal to the total fixed costs minus the fixed costs allocated to cost of sales.
- Also available is the variable cost of sales per unit, which would facilitate the capture of the cost efficiencies achieved.
- Gross profit margins are split in order to distinguish between gross profit margin before unutilized capacity costs (which is the normal gross profit margin that the company would expect to achieve while operating at optimum capacity) and total gross profit margin.
Thus, this budget offers much better insight into the cost structure of the company, with the capability of enabling more effective monitoring of actual costs.
Also note how variances between actuals and budget are better explained when capacity costs are identified in the budget. Two important conclusions can be derived by looking at the variances in the final column: (1) There’s no issue with the gross profit margin before unutilized capacity costs, which is the normal gross profit margin that the business would expect while operating at any capacity. (2) The total gross profit margin shows a negative variance that’s caused by unutilized capacity cost variance, which is reflected in unutilized capacity costs as well as its corresponding gross profit margin.
The company has budgeted for only 25% of its optimum capacity but still has been unable to achieve even the budgeted capacity. The actual vs. budget variance column clearly shows the impact of having lower capacity utilization than was budgeted as well a factual presentation of gross profit variance.
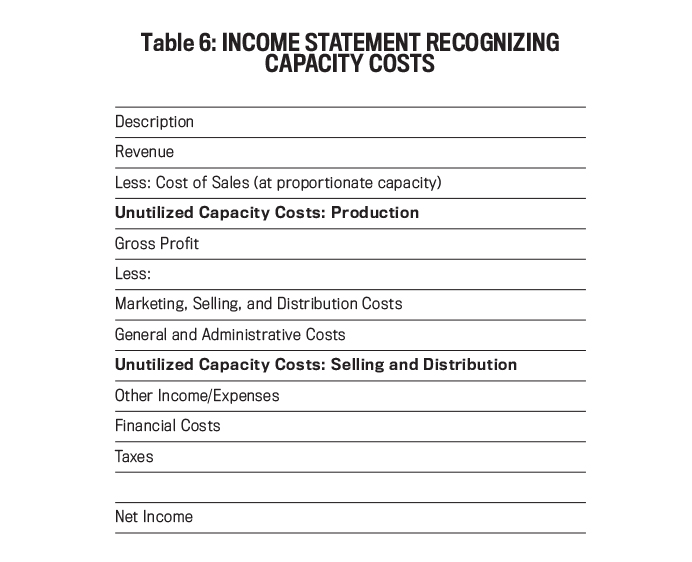
Using this enhanced budget shows that capacity costs could be significant and impact key lines on the income statement. In the example, there’s a marked impact on gross profit margin caused by the separation of unutilized capacity. While this factor is recognized in key business decisions such as product pricing, it also deserves equal recognition in budgets. It can even go beyond the budgets by including unutilized capacity costs as a separate item on the income statement itself. This would enable the matching of costs with revenue, provide greater transparency, and give financial statement users more accurate numbers for comparison. Table 6 shows the items that could be included in an income statement recognizing capacity costs.
INCREASED UNDERSTANDING
With large-scale investments and mergers and acquisitions being a significant part of today’s business reality, enhancing budgets by adding organic and inorganic growth as well as capacity costs will help highlight the impact of new investments and clearly distinguish between the performance of the current and new portfolios. A rugged ERP system can easily enable these add-ons in the budget as well as in actual scenarios.
In my company, we plan to implement balance sheet analysis of inorganic and organic businesses with 2019 budgeting. SAP is fully equipped to deal with this requirement through its “profit center accounting” submodule, which seamlessly integrates with financial accounting. The challenge would be to create a logical business structure within SAP that should stand the test of organizational changes.
With regard to capacity costs, we found this to be an excellent tool to separate capacity-related issues from gross profit variances. This greatly facilitated responsibility accounting and prevented erratic reactions to gross profit when capacity utilization changed even though selling price and variable costs didn’t.

February 2018

