Previously, we had been working on a sample database used by one schoolteacher to cut down on paperwork and track students, classes, and grades. Then other teachers got interested, and its use expanded. Now let’s suppose the school wants to use it to track overall student performance.

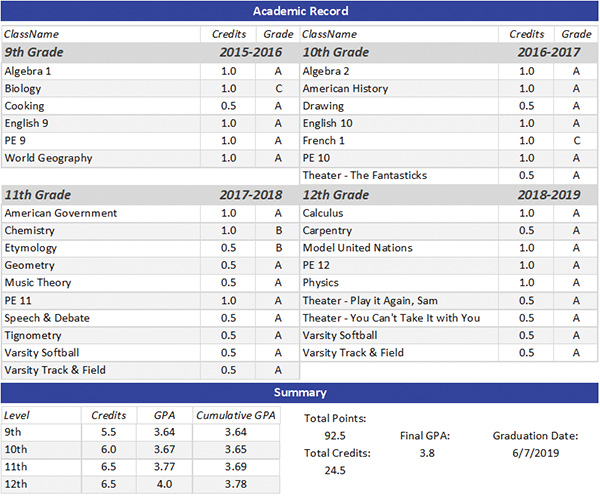
Figure 1 shows part of a student’s transcript. The transcript is a main report based on student data and containing multiple subreports. It uses one subreport four times to display the student’s classes and grades for grade levels nine through 12. We can reuse the same subreport to display the different data because the type of information presented for each grade level is the same.
ACADEMIC RECORD
The Academic Record part of the transcript uses a subreport named “rStudentTranscriptLev_sub” multiple times. The query for each subreport is based on five tables with this SQL:
SELECT StudentClass.StudentID
, Classez.YearID
, StudentClass.ClassID
, StudentYear.Lev
, Yearz.SchoolYr
, Coursez.CourseName
, StudentClass.Grade
, StudentClass.Credits
, StudentClass.Points
FROM Yearz
INNER JOIN (Coursez
INNER JOIN (Classez
INNER JOIN (StudentClass
INNER JOIN StudentYear
ON StudentClass.StudentID = StudentYear.StudentID)
ON (Classez.ClassID = StudentClass.ClassID)
AND (Classez.YearID = StudentYear.YearID))
ON Coursez.CourseID = Classez.CourseID)
ON Yearz.YearID = StudentYear.YearID;
The Coursez table has records of all the courses taught, such as “Algebra 1.” The Classez table stores the specific occurrences of a course and includes the school year and term for each occurrence.
StudentClass is a cross-reference table between students and classes. It stores the credits for the class and contains calculated fields for letter grade and points. Normally, storing calculations isn’t a good idea, but an exception can be made when values become a part of a permanent record.
The Yearz table includes a text field for school year, such as “2019-2020.” StudentYear is a cross-reference table between students and school year and also has the student grade level (Lev), which is 9, 10, 11, or 12.

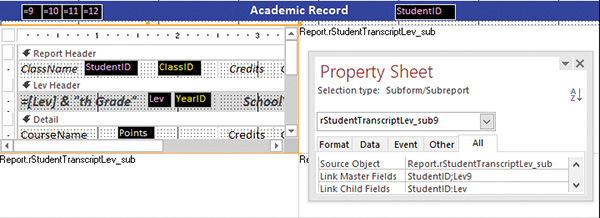
Figure 2 shows the Design view of the Academic Record portion of the main transcript report. It contains four copies of the rStudentTranscriptLev_sub subreport, one for each grade level. When the same subreport is used multiple times, the design will only appear for the first occurrence. Copies are displayed as white boxes that simply show the object type (Report) and source object name.
Controls that aren’t visible in the report appear with a black background color to make them stand out in Design view. StudentID isn’t displayed, but it’s in a control so it can be used for linking. You can also see four unbound controls that are used in linking each of the subreports. The control sources are =9, =10, =11, and =12, one for each grade level, and are called Lev9, Lev10, Lev11, and Lev12, respectively.
The rStudentTranscriptLev_sub subreports are linked to the main report through the combination of StudentID and Lev. StudentID is in the record source for the main report, but Lev isn’t, which is why unbound controls are used. The property sheet shows that the ninth grade subreport has StudentID;Lev9 in the LinkMasterFields property and StudentID;Lev in LinkChildFields, which is the same for each subreport. The 10th grade subreport contains StudentID;Lev10 in the LinkMasterFields, and so on.
The CanGrow and CanShrink properties for each subreport are set to Yes so they will grow as big as they need to be or shrink if there isn’t much to show. Notice that 10th grade has more classes than ninth grade, but they line up with each other. The 11th and 12th grade subreports also align.
SUMMARY PORTION
The Summary part of the transcript contains a subreport called “rStudentTranscriptSummary_sub,” which is based on a query with this SQL:
SELECT q.Lev
, Sum(q.Credits) AS LevCredits
, Sum(q.Points) AS LevPoints
, CCur([LevPoints]/[LevCredits]) AS GPA
, Round([C_Points]/[C_Credits],2) AS C_GPA
, q.StudentID
, DSum("Credits","qStudentClassLev","StudentID="
& [StudentID]
& " AND Lev<= " & [Lev]) AS C_Credits
, DSum("Points","qStudentClassLev","StudentID="
& [StudentID]
& " AND Lev<= " & [Lev]) AS C_Points
FROM qStudentTranscriptLev AS q
GROUP BY q.Lev
, q.StudentID;
C_Points (cumulative points) and C_Credits (cumulative credits) use the DSum function to add points or credits for the respective grade level as well as all previous grade levels. The qStudentClassLev query has StudentID, Lev, Credits, and Points. It gets this information from the StudentClass and StudentYear tables and joins in the Classez table to link them.
The report footer section has three hidden controls to sum points and credits and to calculate the grade point average (GPA). Total points, total credits, and final GPA are then displayed on the main report. The graduation date comes from the Studentz table.
Download the sample database for this story: SF1911_SchoolTranscript.
SF SAYS
You can use an unbound control name in LinkMasterFields. This is handy when you have a subreport that’s used multiple times.

November 2019


