

In December 2023, Microsoft began a preview of its new Copilot feature. Currently, the preview is only available to enterprise customers with more than 100 Microsoft 365 licenses. Microsoft gave me an opportunity to give it a test flight. The results are promising.
Copilot is a broad term for several features at Microsoft. Each app (Excel, Word, PowerPoint, Outlook, and Teams) has different functionality. There is also a Business Chat feature in Copilot that uses a large language model along with data in your calendar, emails, chats, documents, meetings, and contacts to perform tasks. The descriptions below are of the Copilot tools in Excel.
According to Microsoft, Copilot will improve productivity by allowing you to interact with your data using natural language.
Work with your IT administrators to get access to the Copilot preview. Your data has to be stored in OneDrive, and you have to format the data as a Table using Ctrl+T or Home, Format as Table.
You’ll see a Copilot icon on the right side of the Home tab. Click the icon, and a Copilot Preview pane will open on the right. The four main sections are:
- Add new column of formulas.
- Highlight certain data using conditional formatting.
- Sort and/or filter your data.
- Analyze your data using pivot tables or pivot charts.
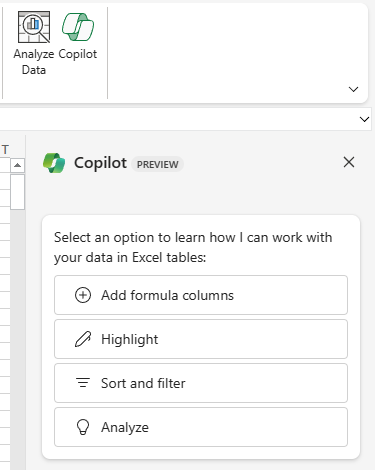
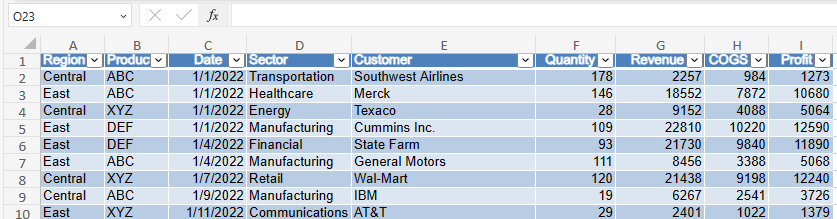
Figure 2 shows a sample data set. There are columns for Revenue, COGS, and Profit.
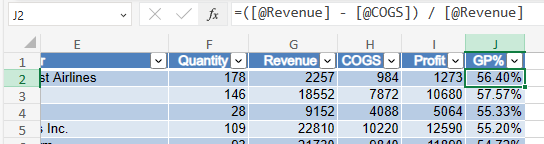
Say that you want to add a column to calculate Gross Profit Percent. In my company, this is generally abbreviated as GP%. I click in the Copilot prompt box and type “Add a calculation for GP%” and press Enter.
Excel takes tens of seconds to process the question. There are various status updates where it says it’s working on understanding the question, then understanding the data.
It eventually comes back with Figure 3. It’s suggested a valid formula to calculate gross profit percent. Just as a note here, if this were my data, I would have come up with a simpler calculation of Profit divided by Revenue, but (Revenue – COGS) divided by Revenue also works.
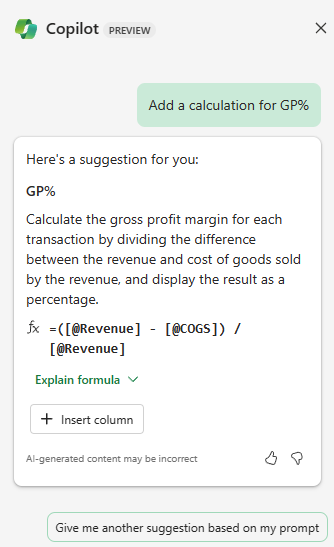
Note that your choices are to have it explain the formula or to Insert the formula as a new column.
If you open the section to explain the formula, it does a good job of explaining how the formula will work, as shown in Figure 4.
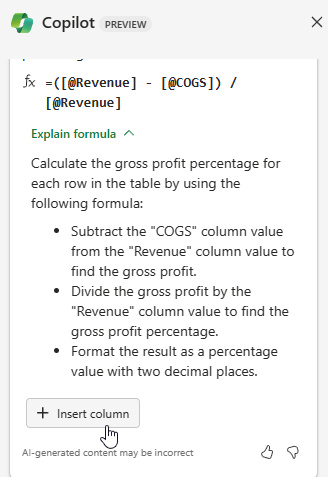
Hover over Insert Column and a preview of the new column appears.
Click Insert Column and you have a suitable formula added to your data set as shown in Figure 5.
In the Copilot pane it reports that they added the column. There is a large button to Undo. There are also feedback buttons where you can report back to Microsoft if the answer worked or not.
Highlighting Certain Cells
I tried a prompt of “Highlight all rows where GP% is in the top 20%.” Copilot answered, “For now, I can only do that for columns in tables. Try asking me to apply formatting in a table column instead.”
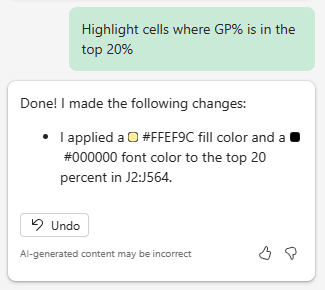
As shown in Figure 6, I then changed the prompt to “Highlight cells where GP% is in the top 20%.” After 10 to 15 seconds, Microsoft has set up conditional formatting to highlight the top 20% of GP% values.
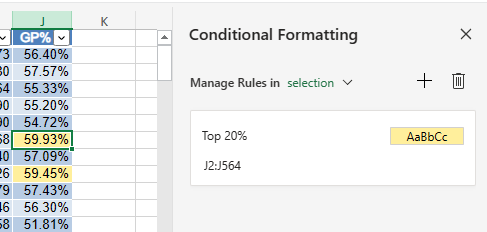
The yellow highlighting appears in the data. To check the logic, I open Home, Conditional Formatting, and Manage rules, and the rules are correct, as shown in Figure 7.
Here are some other examples of calculations created by Copilot:
Running total for revenue:
=SUM(INDEX([Revenue],1):[@Revenue])
Calculate a bonus of 2% of revenue if GP% is greater than 55%:
=IF([@[GP%]] > 0.55, [@Revenue] * 0.02, 0)
Calculate a bonus of 2% of revenue if the product is ABC and the GP% is in the top 20%:
=IF(AND([@Product]="ABC",[@[GP%]]>=PERCENTILE.INC([GP%],0.8)),[@Revenue]*0.02,0)
Calculate a $100 bonus if the quantity is a prime number:
=IF(ISNUMBER(MATCH([@Quantity],{2,3,5,7,11,13,17,19,23,29,31,37,41,43,47,53,59,61,67,71,73,79,83,89,97},0)),100,0)
The first three are correct. The fourth one will work for some rows but not other rows. It does represent a clever approach and certainly better than when ChatGPT tried to make up a nonexistent ISPRIME function as described in the March 2023 issue of the magazine.
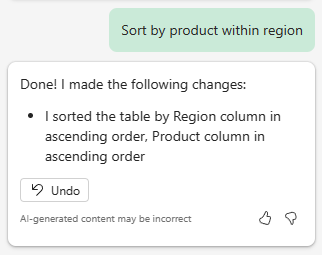
In Figure 8, I asked Excel to sort by two columns and it had no problem with this.
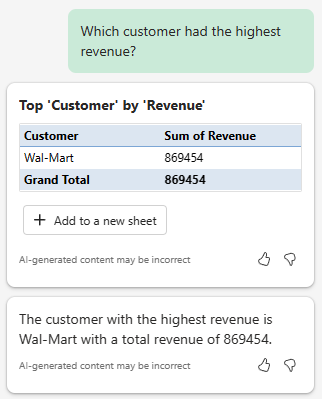
In Figure 9, I asked which customer had the highest revenue. The preview of the pivot table gives me the correct answer.
It Isn’t Perfect Yet
Currently, Copilot seems to fail with some slightly more complex commands:
Highlight all dates in the month of February: the concept of February confused Copilot. It offered to highlight everything in the current month.
Create a pivot table with revenue by year and month and format revenue as currency: Copilot could create the pivot table but couldn’t apply formatting to the revenue values. And then, when I asked it to format the pivot table, it reported that it only worked with tables and not with pivot tables.
Highlight the revenue amount that’s the maximum revenue for each customer. Copilot instead highlighted the top revenue overall and not for each customer.
Promising First Pass
Although it isn’t perfect, the feature is still in preview and shows a lot of promise. As the team at Microsoft gets feedback from the big companies in the preview, it will be able to improve the results.

January 2024

