

Integrating the theory of constraints (TOC), activity-based costing (ABC), and economic value added (EVA) provides a multifaceted approach to managing and improving business performance. It aligns operational and marketing strategies with corporate financial objectives—ensuring that efforts to increase unit sales, improve efficiency, and reduce costs directly contribute to the creation of shareholder value.
This integrated framework, when developed and implemented effectively, can be a powerful tool for companies seeking to enhance their performance and competitive positioning.
To showcase the practical application of this framework, we designed an innovative, nine-credit-hour module for students in our MBA program. The module blended operations management, management accounting, and marketing, notably through strategic-planning exercises and Excel’s Solver optimization.
As part of the module, students applied these concepts in a practicum that involved collaborating with local small and medium enterprises. Students presented their findings to company executives, highlighting the real-world benefits of the TOC-ABC integration for these companies. (EVA wasn’t part of the projects when we taught the module, although we demonstrate the benefit of also including EVA as part of the framework in this article.)
The scope of the practicum allowed students to engage with a wide variety of companies, including both manufacturers of products—ranging from candy to pottery to wood floors—and service providers in such areas as managed healthcare, scientific laboratories, and home healthcare.
This experience provided invaluable insights for both the students and companies alike. The companies implemented many of the operational and/or marketing improvements that came out of these projects. The projects also enriched the students’ learning, showing them the value of taking a comprehensive approach to strategic business improvement.
Students gained exposure to a wide variety of situations where the initial constraint was in operations, as well as where it was in marketing (a distinction we’ll elaborate on later in this article). This mix allowed them to recommend operations and/or marketing improvements within their partner companies. The enthusiastic reception from both business leaders and students underscored the initiative’s educational and practical impact.
Conceptual Foundation
To understand how to integrate TOC, ABC, and EVA, first it’s important to understand the history and benefits of each.
Theory of constraints
Developed by Eliyahu M. Goldratt (Goldratt and Cox, 1984), TOC focuses on identifying and managing the constraint in a process that limits the overall system’s performance. It aims to maximize throughput while minimizing investment in assets and operating expenses. Throughput is revenue minus variable costs. TOC outlines five steps for managing and improving systems:
- Identify the constraint. Pinpoint the system's bottleneck activity using Excel’s optimization feature.
- Exploit the constraint. Maximize the bottleneck's efficiency without any investment.
- Subordinate everything else. Align all other processes to support the constraint (off-loading constraint activity's work).
- Elevate the constraint. Invest to increase capacity at the bottleneck.
- Repeat the process. Continuously identify and address new constraints to improve system performance.
TOC’s usefulness in highlighting situations in which the market is the constraint is also helpful to the marketing manager in making marketing decisions.
Activity-based costing
ABC (Kaplan and Cooper, 1998) is a methodology that assigns costs to products and services based on the resources they consume. ABC enhances the understanding of where and how costs are incurred, leading to more informed decisions regarding pricing, product mix, and process improvements. Its ability to isolate and identify unused capacity is a key feature that sets it apart from traditional costing methods. This capability not only enhances the accuracy of product/service costing, but also serves as a critical tool for operational efficiency, strategic planning, and promoting a culture of continuous improvement within an organization.
Economic value added
EVA (Rappaport, 1986 and Stern and Stewart, 1991) is a financial performance measure that calculates the value a company generates from its invested funds. Essentially, it is after-tax operating profit minus the cost of financing the company’s capital. EVA focuses on wealth creation and is a useful tool for assessing whether a company is generating returns above its cost of capital.
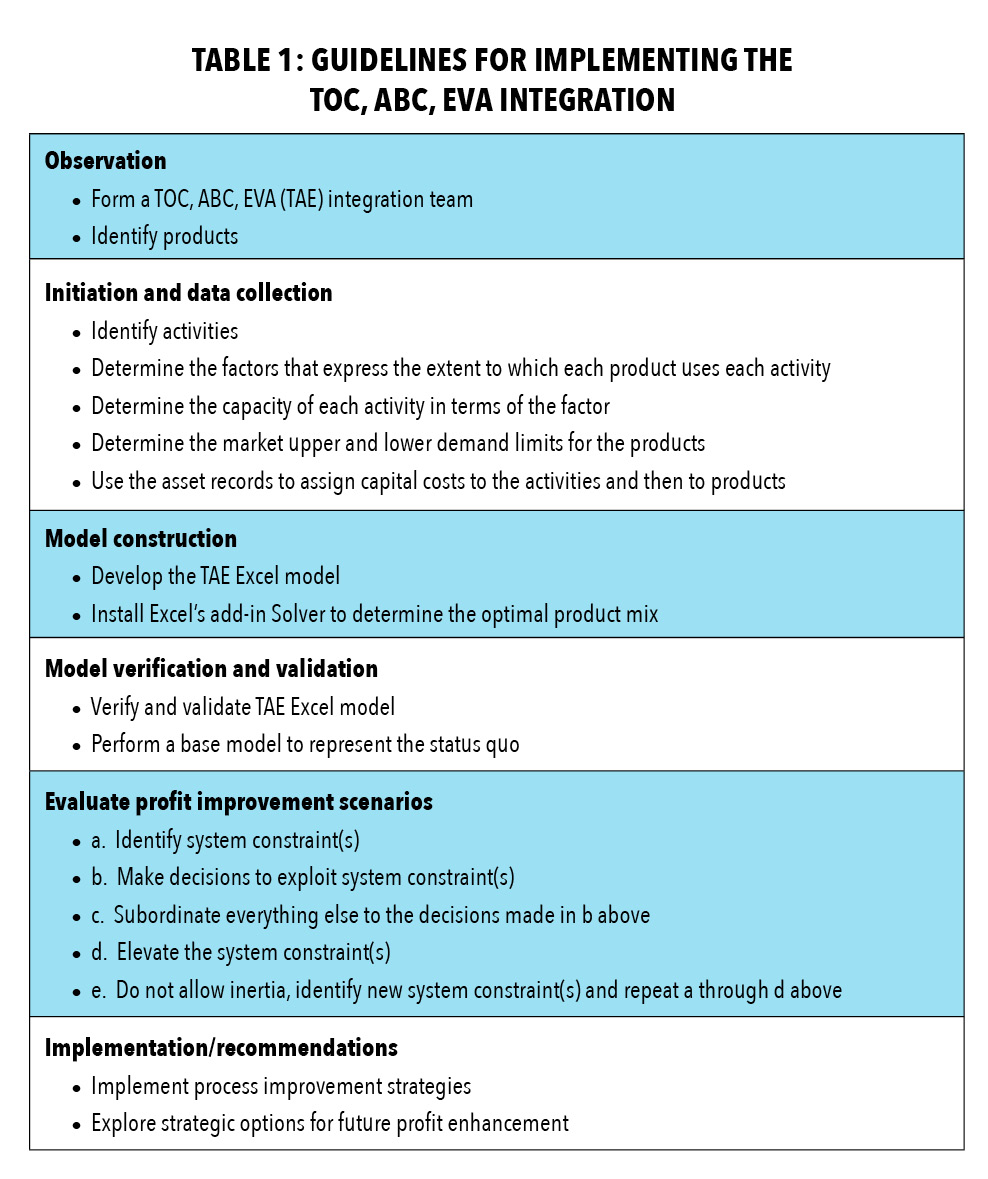
Guidelines for Implementation
In Table 1, we provide guidelines for the integration of TOC, ABC, and EVA (which together we refer to as “TAE”). It’s important to explain that the integration we’re suggesting is within the realm of planning and analysis. Planning and analysis financial statements aren’t constrained by financial accounting standards. Financial accounting standards require absorption costing; however, we’re using variable costing and adding EVA’s economic profit for planning and analysis purposes.
EVA’s Synergy with TOC and ABC
There are at least two specific situations in which the integration of EVA with TOC and ABC provides a benefit to those who use only integrated TOC and ABC in financial planning and analysis:
- When the integrated TOC and ABC reveals that the constraint is in operations
- When the integrated TOC and ABC reveals that the constraint is in the market
Let’s discuss each of these situations in more detail.
Situation 1: The Constraint is in Operations
Most discussions on the TOC steps and the identification of the constraint focus on scenarios where the bottleneck constraint is in operations. The identify, exploit, and subordinate steps target inefficiencies and wastage in the system, freeing up the bottleneck capacity to boost throughput without increasing operating expenses or making new investments. However, the elevate step involves careful investment to provide extra capacity to the constrained activity, which is often expensive machinery.
EVA adds an important new metric for evaluating TOC’s elevate step. It recognizes that an investment in machinery incurs not just annual depreciation and other operating expenses, but also the cost of the capital related to the purchase of the machinery. Thus, the primary metric used to evaluate the favorability of the elevate step should shift from a focus on operating profit to a focus on EVA’s economic profit.
In fact, the TOC, ABC, EVA decision rule to use in evaluating the elevate step should be as follows:
- If the company’s after-tax operating profit increased and the EVA economic profit decreased because of the proposed investment, it’s a signal that the incremental after-tax operating profit didn’t cover the cost of capital associated with the elevate step. In such an instance, the investment opportunity might be presented to company executives anyway. Executives often have strategic insights that can supplement to the information provided by the TOC, ABC, EVA planning and analysis project. In fact, hearing the results might have them considering alternative strategies.
- If the company’s after-tax operating profit increased and the EVA economic profit increased, it means the increase in after-tax operating profit exceeded the cost of capital associated with the elevate step. Therefore, it should be easy to present a convincing case study to executives.
In the case of TOC’s elevate step, the introduction of EVA into the integration of TOC and ABC adds a dimension that’s much like traditional capital budgeting. Capital budgeting evaluates the economic viability of an investment by comparing the multiperiod incremental cash flow internal rate of return (IRR) to the cost of capital percentage. If the IRR exceeds the investors’ imputed cost of capital percentage, the investment is likely to be regarded as favorable.
Situation 2: The Constraint is in the Market
Often, after the elevate step, the constraint moves from operations to the market. In such a situation, the units of production can meet the market demand for everything the company produces, and the factory has unused capacity in all the ABC activities. At this point, the marketing manager becomes the primary actor in the operations manager/marketing manager relationship.
The objective shifts to their ability to be creative in generating market demand for the current or new product(s) that could be produced with the excess capacity. Integrating TOC, ABC, and EVA gives the marketing manager improved analytics tools they can use to develop a marketing plan that’s coordinated with the operations manager’s operating plan. Together, they can determine how best to use the excess capacity to deliver products that will increase the market demand.
TOC and ABC planning and analysis statements already include the after-tax operating profit for each product type. Integrating EVA into this analysis provides the marketing manager the economic profit for each product type. To provide EVA’s economic profit for each product type, it is necessary to determine the extent to which each product type uses the fixed assets for each of the ABC activities.
Roztocki and Needy (1999) devised a method of allocating EVA’s cost of capital to product types. Their method uses depreciation records to determine the distribution of capital equipment among the ABC activities. Based on acquisition cost of the capital equipment, they calculate the percentage of total capital equipment cost associated with each ABC activity. They then use each activity’s ABC operating cost per product type in relation to the activity’s total cost to allocate each activity’s capital cost to each product type.
Once the EVA economic profit has been calculated for each product type and integrated with TOC and ABC, the planning and analysis financial statements provide three linked levels of profit—TOC’s throughput (revenue minus variable costs), ABC’s operating profit, and EVA’s economic profit.
Using an Actual Data Set to Demonstrate the Integration
Let’s use a real-world example to demonstrate the benefits of TOC, ABC, and EVA integration. To do this, we’ll use data collected when we supervised a practicum of one of our student teams. That practicum had students developing a planning and analysis Excel model for a local company. The Excel model was based on the integration of only TOC and ABC, so the EVA portion of this article is based on our reasonable assumptions about selected elements of the balance sheet and statement of cash flows. We then articulated those supplemental financial statements with the student team’s income statement. That articulated set of planning and analysis financial statements provided the capital structure used in calculating capital costs. The capital costs were necessary to make calculations related to EVA. The company had 11 production activities and 10 products, which included flavor and color additives sold to food producers.
To keep the planning and analysis financial statement shown in Table 2 simple, we’ve assumed that the company is closely held and that the owners eschew debt and annually distribute dividends equal to the after-tax income. As a result, there are no retained earnings at the end of each year. The bottom portion of the balance sheet (not shown in this article) has only an amount for accounts payable and equity (the amount invested by the owners). The accounts payable is a debt that has no cost associated with it. Therefore, only the equity amount is used to calculate the cost of capital. We assumed that the cost of capital after-tax rate expected by the company owners is 15% per annum. Therefore, the annual cost of capital is 15% times the dollar amount of the beginning of the year equity on the balance sheet.

Actions Taken in Each of the Focusing Steps Shown Above:
Identify step: It is based on the product mix that existed at the start of the study. At the start, the dehydrating activity was the constraint; but the product mix was not optimal.
Exploit step: Reduced ABC's intensity of usage factor by 2% for the production labor, blending, dehydrating, pumping, and recycling activities to reflect reduced down time for cleaning machinery between batches. Decreased down time was possible by increasing the batch size of the production run and by making products with similar colors one after the other. Used Excel's Solver to optimize product mix.
Subordinate step: This step offloads from a constrained activity to a non-constrained activity. Delayed the inclusion of powdered lime until after the dehydrating activity and introduced it in the blending activity. The blending activity had 24% unused capacity. This action reduced ABC's intensity of usage factor by an additional 1%. Used Excel's Solver to optimize product mix.
Elevate step: Purchased additional dehydrating equipment and improved existing equipment. The cost was $70,000 and the owners invested an additional $70,000 in equity. The capacity of the activity increased by 10%, reduced the intensity of usage factor by an additional 10%, and increased the annual operating cost by 25%. The additional annual depreciation is included in the operating cost.
Used Excel's Solver to optimize produce mix.
How did we select 15% per annum? That’s the estimated opportunity cost associated with the risk profile of the company. Companies subject to cyclical economic trends are likely to have a higher cost of capital rate. Companies subject to more economic stability are likely to have a lower cost of capital rate. It’s always true that the cost of equity capital rate is higher than the interest rate on debt because the debt holder has a priority claim on the company’s assets in the case of default. Also, the interest on debt is income tax deductible and the cost of equity capital used in calculating EVA is not tax deductible. In fact, the cost of capital used in calculating EVA isn’t even recorded in the company’s accounting system; it’s an imputed amount reflecting the opportunity cost the owners could expect from investing in any company with a similar risk profile.
Suggested Marketing Actions:
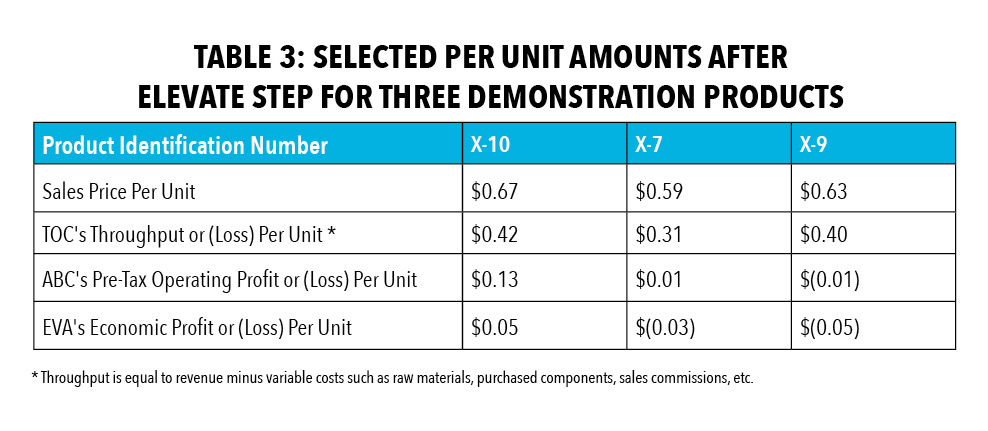
Product X-10 is making positive contribution to the company's increase in economic profit. No action suggested.
Product X-7 is increasing the pre-tax operating profit by $.01 per unit of product. When the cost of capital is considered, it is subtracting $.03 per unit from the company's economic profit. Perhaps the pricing of the product should be evaluated and/or a more intense promotion of the product should be considered.
Product X-9 has an operating loss of $.01 per unit and an economic loss of $.05 per unit of product. Replacing this product with a more profitable product should be evaluated. Replace the product only after performing a special study to compare the “before and after” of the replacement. Do not be tempted to drop the product without a more profitable replacement. Dropping the product without a more profitable replacement would eliminate the $.40 per unit of throughput. That $.40 per unit of Throughput is currently being used to partially cover the fixed operating and capital costs of the company.
Tables 2 and 3 record selected items from the integrated TOC, ABC, and EVA Excel model that was created by the authors. The authors’ model used the data that was used in the TOC, ABC income statement Excel model created by the student team. The authors also used data from the articulated balance sheet and statement of cash flow that was created by the authors.
Table 2 provides selected metrics taken from the TOC, ABC, and EVA planning and analysis financial statements that provide the basis for this article. The selected metrics are based on the articulated set of financial statements after each of TOC focusing steps is performed. As each focusing step was performed, the resulting financial statements provided the basis for the next focusing step. Thus, the financial impact of each focusing step is carried forward to the succeeding focusing step.
At the top of Table 2, you can see that in the first three steps, the number of product units sold (pounds of product) during the year is less than the estimate of the maximum unit demand for the year. In the middle of Table 2, you can see that all but one activity had unused capacity over the span of the first three focusing steps. The dehydrating activity had no unused capacity until the implementation of the elevate activity, when additional dehydration equipment was acquired. After installing the new dehydration equipment, the unused capacity increased to 10%. The constraint was no longer in the dehydration activity in operations. It had moved to the market.
The constraint moving to the market is also confirmed by the fact that total unit sales were equal to marketing’s estimate of maximum unit demand after the elevate step was completed. The company has 10 product types—product type X-1 to X-10. The first two rows of Table 2 also reveal, at the end of each step, the extent to which the company’s total market demand was met. After completing the identify step, none of the products had met their demand because the production wasn’t operating optimally. After the elevate step had been completed, all 10 of the products were meeting their maximum demand. As we complete the elevate step, the marketing manager has become the primary actor ahead of the operations manager.
The other metrics in the upper part of Table 2 show that, as the steps progress, the profitability metrics improve incrementally. After the purchase of additional dehydrating equipment in the elevate step, after-tax operating profit increased from $143,437 at the end of the first step (identify step) to $220,380 per year after completing the elevate step. However, economic profit was still a negative $30,120 per year after the elevate step.
The lower portion of Table 2 reveals that, after completing the elevate step, all the activities had unused capacity, and the dehydrating activity had 10% unused capacity. When all the operations activities have available unused capacity, the TOC’s fifth focusing step shifts the focus to marketing as the constraint.
The information in Table 2 suggests an opportunity for the operations manager and marketing manager to cooperate. After the elevate step, the market is the constraint—but, in every activity but the dehydrating activity, there is a lot of unused capacity. This should have the two managers considering a new product they could create that doesn’t require the dehydrating activity to produce, perhaps a liquid color or flavor additive. The marketing manager could explore the market potential for this liquid product, while using the 10% unused dehydration activity to expand the traditional colors or flavor additives. This makes it easier for operations and marketing to coordinate efforts, and encourages the managers to get creative in how they use the excess capacity while increasing market demand for the company’s products.
Table 3 shows sales per unit and the per-unit profit elements for each of the three segments of the integrated planning and analysis income statements—TOC, ABC, and EVA. The columns of Table 3 provide the per-unit information of three of the company’s 10 products—products X-10, X-7, and X-9. We chose those three products because they represent three typical product profitability profiles of interest to marketing managers.
The lower portion of Table 3 contains comments about each of the product profitability profiles. Those were included to suggest possible actions the marketing manager might take, either alone or working with the production manager.
Table 3 reveals another advantage of integrating EVA with TOC and ABC: the “attention directing” aspect of including EVA’s economic profit per unit of product metric along with TOC’s and ABC’s. If a product isn’t profitable, EVA’s economic loss is going to be more unfavorable than ABC’s operating profit. Therefore, product X-9 is likely to be the one drawing the most attention. Additionally, EVA’s economic profit is the one that’s most aligned with the objective of the company’s owners. It reflects the opportunity cost that the investors have incurred by investing in the company.
Conclusion
The integration of TOC, ABC, and EVA provides a more comprehensive presentation of financial planning and analysis information in the form of an articulated set of pro forma financial statements. That information equips operations managers in making operating decisions when the constraint is in operations, and marketing managers in making marketing decisions when the constraint is in the market.
However, other decisions require the operations and marketing managers to coordinate their efforts. When EVA, ABC, and EVA are integrated, they can provide information that’s simultaneously meaningful to both managers in terms of attention directing—all while aligning the actions of the managers with the objectives of the investors.
|
Further Reading Eliyahu M. Goldratt and Jeff Cox, The Goal, North River Press, 1984. An introduction to Theory of Constraint and the Five Focusing Steps. Robert S. Kaplan and Robin Cooper, Cost and Effect: Using Integrated Cost Systems to Drive Profitability and Performance, Harvard Business Review Press, 1998. An introduction to Activity Based Costing. Alfred Rappaport, Creating Shareholder Value: The New Standard for Business Performance, Free Press, Collier Macmillan, New York and London, 1986. The first author to focus on Shareholder Value Added and the first to use the term “Economic Value Added” (EVA).
Joel Stern and G. Bennett Stewart III, The Quest for Value: A Guide for Senior Managers, Harper Business, 1991. These authors popularized the term EVA.
Narcyz Roztocki and Kim Lascala Needy, Integrating Activity-Based Costing and Economic Value Added in Manufacturing, Engineering Management Journal, June 1999. Includes a discussion and an example of the allocation of EVA’s cost of capital to products based on Activity Based Costing information. |

