

There are several ways to add calculations to a pivot table in Excel. Today, you’ll see how to use a Calculated Item to add a new row to a pivot table.
Figure 1 shows a pivot table with four regions. The goal is to combine two regions for reporting purposes. Note that the total revenue in the report is $6.7 million. One problem with Calculated Items is how they impact the grand total in the report, and you will see how this number is temporarily wrong during the process.
In this case, you are adding a new Calculated Item to the Region field. Make sure to select a cell from A3 to A7 before adding the Calculated Item. This tells Excel that you want to add a new row in the Region area.
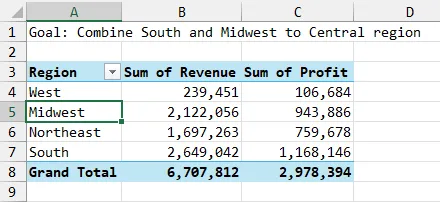
Figure 1
On the PivotTable Analyze tab, open the Fields, Items, and Sets dropdown menu, and choose Insert Calculated Item.
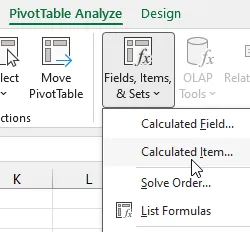
Figure 2
Type a name for the new Region. In Figure 3, this is Central. Note that the formula always starts with an equals sign, a space, and a zero. You need to click at the end of the formula and backspace through the zero (and optionally through the space).
This new Central region will be a combination of the South and Midwest regions. You can simply type South+Midwest, or you can double click on South in the Items box, type a plus sign, and then double-click on Midwest in the Items box. Note that spaces before and after each item in the formula are optional.
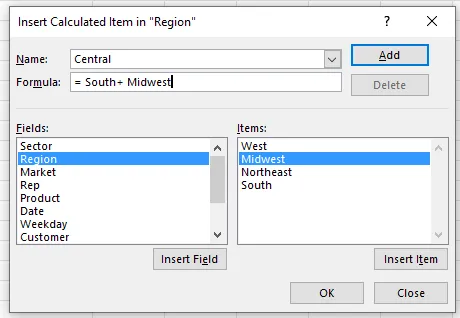
Figure 3
When you click OK, Excel adds a new row to the pivot table for the Central region. The row always appears at the end of the list of regions. Notice that the Central region is correctly showing the total of South and Midwest. However, the bad side effect here is that the Grand Total row has increased from $6.7 million to $11.5 million. This is because the revenue for Midwest and South are in the pivot table twice.
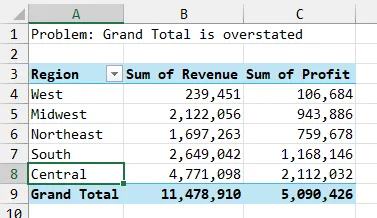
Figure 4
To solve this problem, open the Region drop-down in cell A3 and remove the former regions that are in the new Central region.
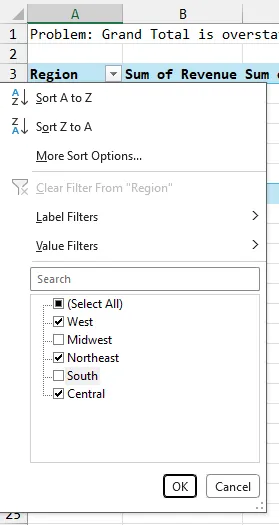
Figure 5
The result: the Grand Total revenue is now back to the correct $6.7 million. Also, note that when you select the Central region total in cell B6, the Formula bar reveals the formula behind the calculated item.
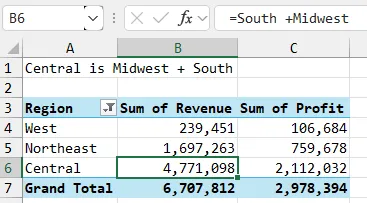
Figure 6
Personally, I avoid Calculated Items. Someone else using your spreadsheet could forget to remove the South and Midwest regions, and then you would end up restating your numbers to the SEC!
It might be easier to use the Group Selection feature in Excel to combine the two old regions into a new region.
This is a new pivot table. Select the cell for the South region. Ctrl+Click on the cell for the Midwest region. In the PivotTable Analyze tab, click Group Selection as shown below.
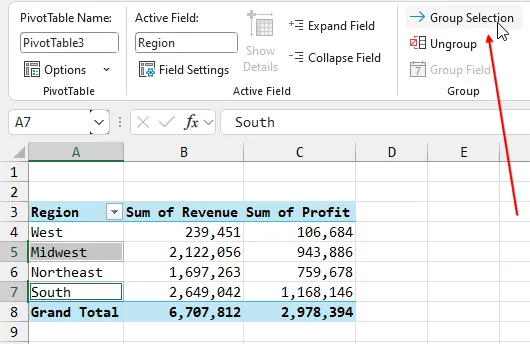
Figure 7
Excel follows some default rules that you will certainly want to override. In Figure 8, you will see that the original Region field is now in column B, and a new field called “Region2” is in A3. The Region2 value for all of the ungrouped items stayed the same. But the Region2 value for the grouped items have a name of Group1.
(Note that in another example, you might choose to group West and Northeast next. Those items would have a default name in Region2 of Group2.)
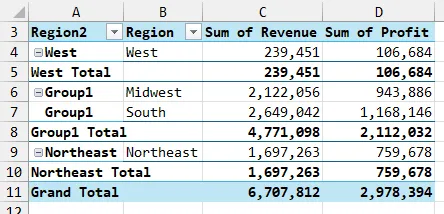
Figure 8
It’s easy to change the default name for the new field and the group. Click in A3 and type a name of “New Region” or “Region 2024” (or anything you want).
Then, click on the first Group1 label in A6. Type Central and press Enter. Microsoft will change the word Group1 to Central in 3 places, as shown in Figure 9.
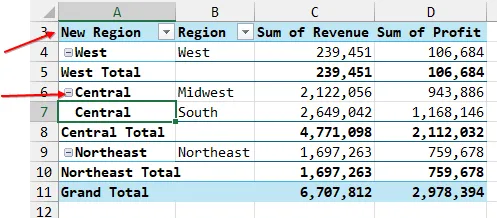
Figure 9
By using Group Selection, you have more flexibility in reporting. You could choose to remove the original Region field from the pivot table. Or, you could collapse the West and Northeast regions by clicking the tiny button with a minus sign to the left of the word “West” and to the left of the word “Northeast.” That produces the following pivot table, which shows the two former regions that roll up to the new Central region.
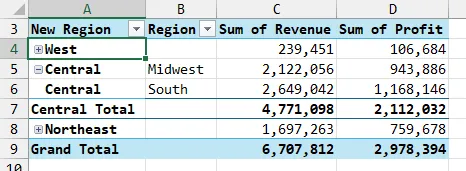
Figure 10
Most importantly, note how the grand total revenue has been correctly reported at $6.7 million in each of the three figures after grouping the selection. There is never a temporary state where the grand total is overstated when using Group Selection instead of Calculated Items.


Publication Highlights
