Undoubtedly, advances in IT are hot. But technology won’t work as well as it should if accountants fail to take preliminary steps to integrate it with their organization’s business processes and data management. Applying new IT tools might lead to gains in efficiency, but they also might fail to make related gains in effectiveness.
Tools, including the ever-popular Big Data, are part of a solution but not the whole solution. To use a simple analogy, a tool to get rid of garden weeds will be efficient if you’ve answered the questions: What are weeds? Why use a tool? And how can I best use this tool?
CAUSE-AND-EFFECT RELATIONSHIPS
Efficiency and effectiveness aren’t synonyms. Efficiency has been described as “doing things right” and effectiveness as “doing the right things.” In other words, applying a popular new IT tool might lead to doing something better than it was being done before, but that might not be the right thing to do. By adding effectiveness at the beginning of the solution, then the right thing will be done, with the right tools, in the right way.
Let’s examine the use of source information to derive financial reports. This focus on data integration through and across business processes is important because the financial team is expected to have more cross-functional involvement, which will enable the efficiencies from new technologies to be applied effectively with integrated data management as the underlay.
For example, Gary Cokins and Alan Dybvig noted that using emerging technology for the operating income statement (OIS) enables a focus on cause-and-effect relationships, but what’s needed before applying that technology is a fundamental analysis of operational needs. This implies that the cause-and-effect relationship through modeling—a contemporary tool—will occur automatically but doesn’t define how that seamless integration occurs. Cokins and Dybvig go on to note that the focus should be an underlying analysis of the causes of operational expense. This good start, however, ignores operations that enable revenue. But both expense and revenue information are used for financial reporting, so the solution must include both. (For more, see “OIS for the Operational CFO,” Strategic Finance, February 2017.)
MAKING DATA INTEGRATION WORK EFFECTIVELY
Alas, talking about effectiveness through data integration isn’t as much fun as discussing new technology tools. This way of thinking needs to be rebalanced so that new tools can be applied properly and usefully. Isaac Tucker, for example, clearly noted that companies should not, among other things, see the solution as just a technology story, automate bad processes, and forget people’s needs. They should see technology applications as a means to continually improve, not as an end.
Tucker went on to say that “continuous accounting” could be achieved through data connectivity so as to unify rules-based automation tools to auto-certify reconciliations, account balance substantiation, task management tools, and finance performance management reporting and analytics. (To learn more about continuous accounting, see “The Blueprint for Continuous Accounting,” Strategic Finance, May 2017.)
These points are right on target. The issue is how to get them done.
The secret to success, I’ve found, is merging new technologies with the solid underpinnings of integrated data and business process management. This integrates efficiency and effectiveness—doing the right things in the right way.
What gets in the way of doing this is that merging derived financial information and source operational data isn’t easy and can go awry unless two other issues are addressed and resolved. First, your organization must decide who needs what information. The financial team has a distinctive primary audience—an external one—with different information needs from their cross-functional counterparts. Second, if the cross-functional differences in information uses and needs can be identified, then the solution can be an acceptable shared approach.
LOOKING OUTSIDE THE ORGANIZATION
The financial team is tasked with presenting monetary information externally. Current and prospective shareholders, other sources of funds, regulators, legislators, and other external parties—including public accountants and auditors who must assure the correctness of such information—want to know how performance compares to other investment options. Laws and regulations, as well as the people affected by them, require external reporting in formats that enable comparisons and trend analyses. These formats are based on common rules that involve the portrayal of results covering income, expenses, taxes, cash, investment, inventory, assets, compensation, and the like.
This external focus is so strong that financial management and accounting professionals often see monetary information as primary information. Then they apply analytical tools to get to what comprises that financial information rather than understanding that their functional counterparts have access to and rely on the underlying source information.
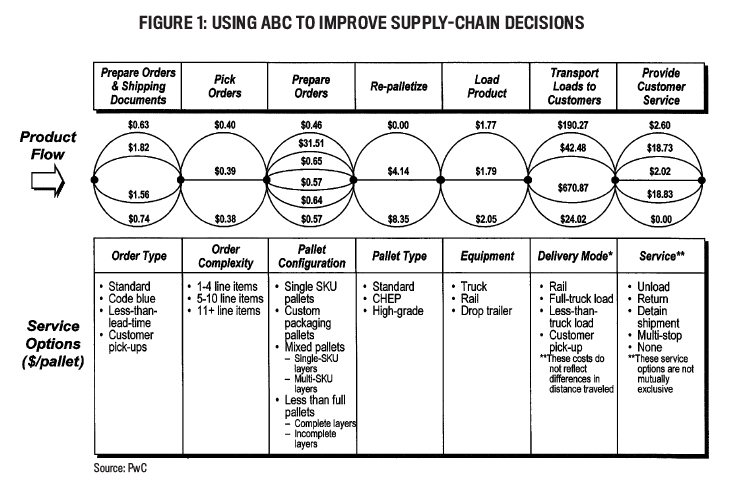
A better way is for accountants to connect financial information to the operational sources of that information. To illustrate this point, Figure 1 depicts activity-based costing (ABC) time-driven source information used by consumer products manufacturers to address the effects of customer-specific requirements on warehousing and shipping, as well as which differences are based on operational source information and not on derived financial information.

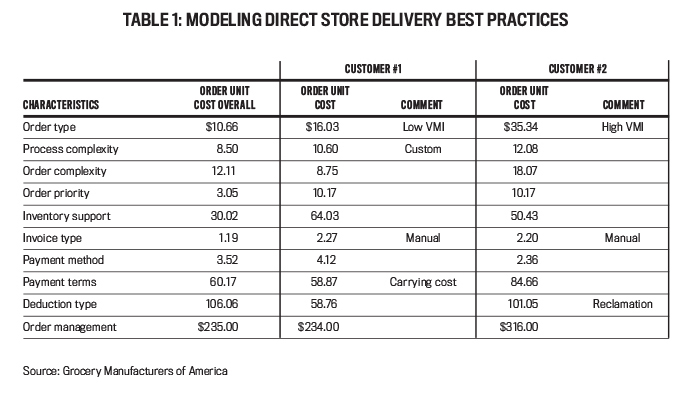
This reliance on source information isn’t unique to individual companies. Table 1 is an example of source information used to analyze order-management costs across an industry. It shows that when order costs are treated as derived from financial numbers (the “Order Unit Cost Overall”), average cost doesn’t reflect the actual operating costs caused by specific customer situations. Here, Customer #1 is at about the order unit cost average, whereas Customer #2 has order unit costs that are about 20% higher than the average due to the costs associated with greater inventory support and with different payment terms. Such distinctions can only be found by starting with operating costs as the source of derived financial information.

THE NEED FOR OPERATIONAL SOURCE DATA
The financial team can have problems dealing with cross-functional executives because they often don’t speak the same corporate language. One uses monetary information, the other operational information. Cross-functional executives use the latter to manage, with a focus on such business imperatives as finding the right people, products, customers, projects, and processes, as well as laying the groundwork for effective compliance and controls, risk management, and supporting tools.
Top executives want information segmented by market and product line, customer, geographic and demographic segments, project and process, equipment, and skill, to name just a few. And these segmentations can’t always come from monetary reports. Moreover, these segmentations can be more important to the cross-functional team than the financial summary. As examples, consider a manufacturing company:
- The sales executive needs to know how many of each stock-keeping unit (SKU) were sold, at what prices, and to whom. Financial information—revenue—is derived from SKU quantities sold multiplied by sales prices.
- The operations executive needs to know how many of each SKU have been shipped and from where. Financial information—cost of sales—is derived from the quantity of a SKU that was shipped multiplied by the unit cost of the SKU (which particular unit cost is applied is usually the combination of source information dealing with costs of raw materials and the time, personnel, and machine costs needed to convert those supplies into finished products).
- The purchasing executive needs to know how many of the SKUs remain in inventory and what might be needed. Financial information (accounts payable) is derived from the quantity and unit cost of what’s purchased.
- The marketing executive needs to know who is buying what and where and whether advertising and other forms of promotion were helpful in generating the sales. Financial information might or might not be derived by geography and customer, and marketing expenses aren’t necessarily associated with program results.
And so on and so forth. You get the idea. These scenarios can apply generally to any services or manufacturing company.
Often these different focuses lead to disconnected operational and financial systems. Michael Porter, the guru of business strategy, is very clear about what he describes as the value chain of the organization (inbound logistics, operations, outbound logistics, marketing and sales, and service) and its supporting infrastructure (administration, technology, human resources, and procurement) as the basis for business processes and data flows. In effect, data received by the value chain components and transmitted among them is operational source information, not derived monetary information, and that operational perspective should be the basis for applying any new technologies.
Knitting together these disparate uses and formats enables the financial team to get more involved on the cross-functional side, and this must precede the use of advanced tools so that the financial team doesn’t get bogged down in interpreting linkages among disparate systems. The key is to design and build one integrated system based on source data to enable all functional parties to derive information useful to and required of them. This allows the financial team to deal more easily with their functional counterparts because they’re all using a common system with common data. When everything’s firing on all cylinders, the financial team can contribute externally with monetary reports and internally with reports that their operational counterparts understand, appreciate, and value.
THE MANAGEMENT ACCOUNTANT’S ROLE
As a management accountant, you’re in a great position to be the bridge. Since you should be familiar with the various ways that information is used, and with such tools as ABC, you can serve as interpreter, designer, expediter, and project manager to meet the analytical needs of all the functions in the organization.
A case in point: Some years ago, I became the CFO of Booz Allen Hamilton when it still was an independent, international consultancy primarily serving commercial clients. I quickly discovered that my partners were angry at the cost and perceived lack of value in the financial function. Because it took more than two weeks for the month-end close, executive committee deliberations that were based on financial results weren’t timely. Days of outstanding receivables hovered in the 40s, so the chairman wanted “out of the banks” (that is, having no borrowings) at least once a year.
Getting the right staff assigned to a project or to a competitive proposal was a matter of clout and cunning. Client-serving partners wanted to know who was winning competitive situations, what staff members were performing well on what projects, how well targeted billing rates were being realized, and so on. But this information wasn’t in the financial reports and had to be discovered through analysis or by creating independent systems and tools. These independent approaches could cause executive committee meetings to degenerate into arguments about whose numbers were right.
Things weren’t working very well.
It was clear that financial reports could derive from the operational data and that, through integration, we could reduce costs, serve all parties with consistent information, and increase trust and confidence in reports. The set of business imperatives was:
- The right people,
- The right clients,
- The right assignments,
- Effective controls, and
- Efficient tools.
There were two kinds of management needs: operations (by markets and practice, client, office, assignment, and skill) and financial (cash, compensation, income, expenses, and taxes). The integrated systems framework was designed with minimal redundancy, ease of access and use, and with some local options in our 25 offices in 12 countries. This approach enabled three categories of systems applications:
- Administrative—for marketing, staffing, assignment management, control, and accounting;
- Professional—for contacts, mailing, client history, résumés, qualifications, and skills; and
- Support—for modeling, analysis, file and document retention and transfer, graphics, word processing, report production, and databases.
The drivers of all these systems became business forms that captured operations data, which was entered only once and at the source and not necessarily by the function that was interested in all the data being entered. For example, when a new client project was begun, the selling office needed to know the client’s name and related specifics as well as the name and size of the project. They didn’t necessarily need to know the nature of the project or proposal, the staff who would be assigned to it, and the start date, yet they would enter this information nonetheless. By doing so, the system could “remind” the team leader when to bill and could track that it was done (this cut the days outstanding in half). Even though we were “out of the banks” at least once a year, our borrowing days had ended with the improvement in days receivables outstanding, with the concomitant switch from interest expense to investment income!
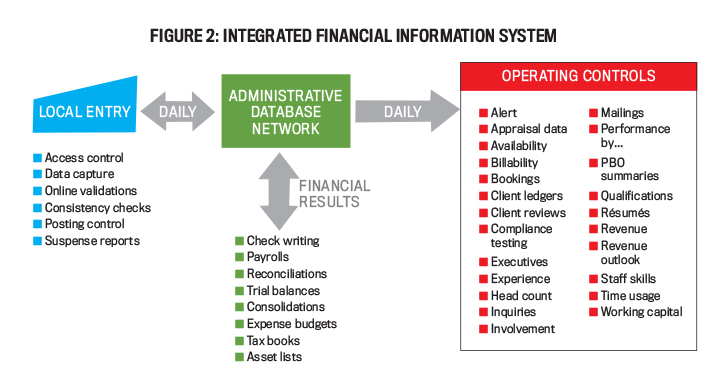
Figure 2 shows what the integrated system looked like. As you can see, financial information was derived from the source data used for operational information. To ensure control, only authorized formats were used, online entry systems were tested for integrity and database consistency, critical information was derived, key accounting routines were automated, and audit trails and layers of security were included.

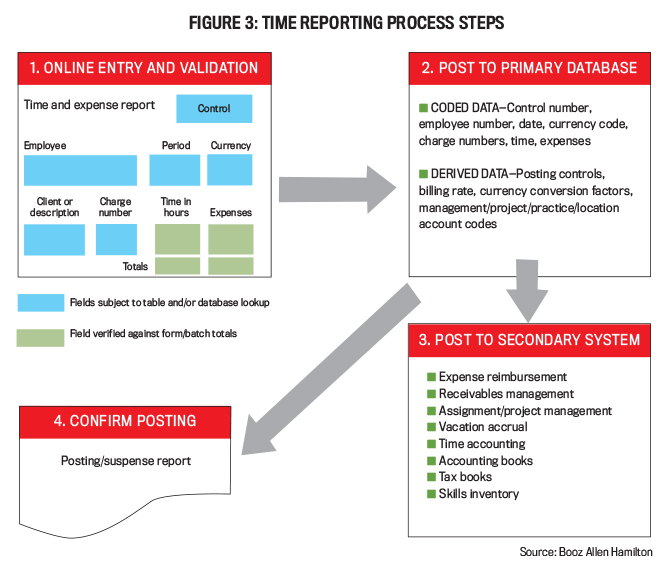
Figure 3 depicts how this was applied to business forms, showing the processing steps for time reporting. “Online Entry and Validation” dealt with all the operating information being entered from the source—namely, the staff member’s time and expense report—and then validated. This led to the primary database, with the source data coded, and then the financial data derived. This primary database enabled a set of secondary, but integrated, systems dealing with specific objectives ranging from expense reimbursement through skills inventory. At the same time, a posting/suspense report identified any posting discrepancies in such information as client, project, staff member, hours, billing rate, etc., so these could be resolved continually and not only at month-end.

MANY IMPRESSIVE RESULTS
Here’s what we achieved by placing the focus on source data to derive financial information:
- Corporate expenses shrank by about 20%, with data integrated and systems and processes simpler to manage and control. Special analyses were no longer needed.
- Financial reports were prepared one day after the month-end, allowing the executive committee to make timely decisions in the first week of the following month.
- Similarly, year-end closings were completed within two days, and negative findings about control issues—which had been ample—were eliminated.
- Daily updates and special analyses also were timely, and client-serving partners shifted from discomfort with the financial function to respect for it.
- Timely billing led to fewer end-of-assignment losses and surprises.
- Better analyses of staff members’ skills and effectiveness led to better staffing and better results. For our competitive proposal efforts, to use one example, we saw an increase in wins from 25% to 33%.
We learned a lot more, too. Providing helpful results from systems led to better management attention and discipline. Second, project evolution and prototyping—starting small things with big objectives and quick results—helped gain support. And simple designs and consistent approaches allowed users to improve their work patterns.
MAKING IT WORK FOR YOU
How can you apply these concepts to your situation? First, don’t focus on the tools until you’ve integrated your source data and derived information. Begin by exploring each function in terms of the data that it either has or wants—or, better still, should have—to manage and control its operations, through interviews and supported by research from relevant professional organizations. For each function, trail the data to the source transmittal (electronic or hard-copy form or document), then review the transmittal content to determine that it’s adequate and going to the right people. Identify any changes or additions to be made to the transmittal, its point of receipt, and its method of data entry.
Work with the finance function to ensure that the source data can be used to derive the information that they need. Conduct a meeting to ensure that everyone is comfortable with the format and the entry in terms of content, timing, controls, and access. If necessary, redesign the transmittal, as well as the data entry and receipt activities. Finally, redesign the processes for users to access and apply the data.
Once operational, ensure that all source data is entered as close to the source as possible in the interests of the organization as well as the function entering the data. Confirm the ability to derive monetary information automatically from the source data, as well as whether deriving financial information from the source data results in accurate and timely outcomes. Moreover, the finance function, the internal audit function, and the external auditor should be comfortable that the outcomes are accurate and controlled.
Finally, have a follow-up meeting to confirm that everyone’s interests are being served, including those of their functional counterparts. Make sure that your organization’s leaders understand how financial information is now derived from their operational data. By following these guidelines, your data and processes will be effective, and the latest IT tools can be applied to increase efficiency.
KEY LESSONS
In my many years as a CFO and management consultant, I’ve learned three key lessons from all of this. First, the organization can work better as a team once financial information is understood to be derived from the operational data, which is important to the finance team’s cross-functional counterparts. Second, in order to be truly effective, data integration and business process management should come before applying any new IT tools. Third, make good use of these tools to gain efficiency.
None of this will be easy, and it will take a concerted, coordinated effort on the part of your organization’s managerial teams. But the sooner you realize that efficiency and effectiveness aren’t one and the same, the sooner you’ll be able to harness the true power of both.

April 2019


