Following the turbulent years of supply chain disruptions and product shortages during the height of the COVID-19 pandemic, CFOs and companies alike have wondered when the most damaging effects will finally be in their rearview mirror. Yet supply chain problems have continued to intensify, leading to an inability to meet the pent-up customer demand that grew during the pandemic and stymying companies’ revenue growth.
CFOs possess the acumen to serve as valuable partners in the operations of their businesses and are uniquely positioned to act as collaborators and integrators throughout their organizations to counter these challenges with solutions. To enable their business partners to envision the future, they use data analytics to make predictions, gain insights, and guide strategic and tactical decisions throughout the business. Thus, CFOs are partners, catalysts, and visionaries who serve as agents of change—consistent with competencies embodied in the IMA® (Institute of Management Accountants) Management Accounting Competency Framework that finance professionals need to remain relevant in the Digital Age.
CFO TRENDS IN SUPPLY CHAIN MANAGEMENT
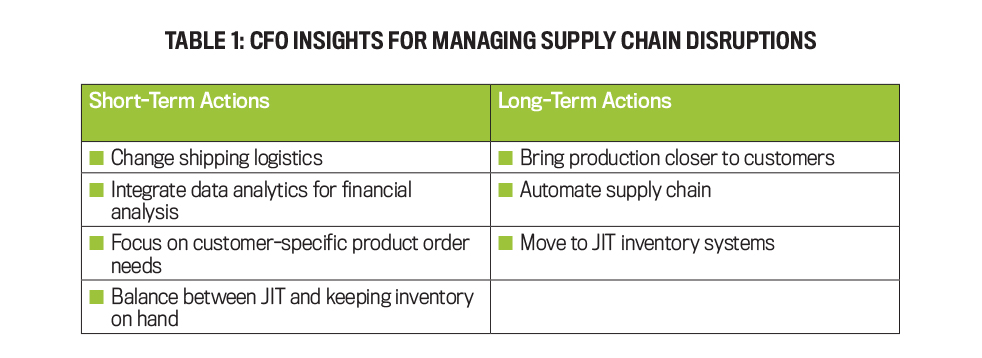
In the face of these recent supply chain issues confronting global trade, CFOs have had no option but to adapt their businesses to yield positive results. What actions are they taking? We spoke with several CFOs to gain insights into the ways they’re addressing supply chain disruptions. There were some recurring themes of the short-term and long-term best practices they’re employing to adjust their supply chains. Table 1 summarizes key insights from these discussions.
First, while CFOs acknowledge the need to bring production closer to their customers, they also know this takes time. Yet investors and boards of directors expect immediate results. Thus, CFOs are seeking changes to their shipping logistics by renegotiating and expanding contracts with third-party logistics companies as an efficient option for getting product to customers.
Second, while they see supply chain automation as important, they also concede it will take time and investment to build the technology into their operations. In the short term, they’re focusing on integrating more data analytics into their financial analysis so that the finance team can employ the right key performance indicators (KPIs) to help run the supply chain. Yet a common stumbling block in building data analytics capabilities is developing a clear return on investment, so CFOs are keen to point out that their focus must be on providing leading indicators that equip them with the right capabilities to drive strategy through insights and analysis.
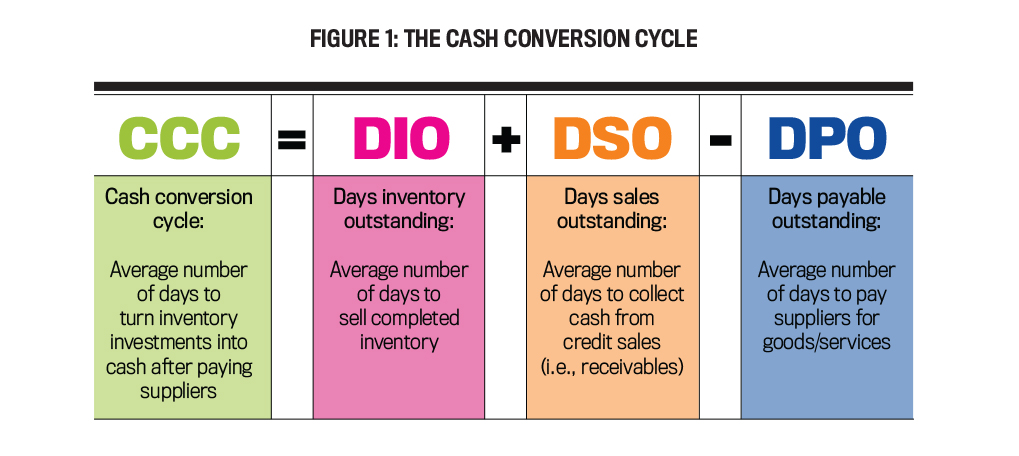
Key metrics they cited include the cash conversion cycle, the sea-to-air ratio, the amount of inventory on hand, and distribution and storage costs as a percent of sales. As shown in Figure 1, the cash conversion cycle (CCC) is an integrative tool that combines three metrics to assess a company’s efficiency in selling inventory, collecting receivables, and making payments as a broad indicator of actions needed throughout the business to improve cash flow.
The sea-to-air ratio, which measures the proportion of ocean freight shipments vs. air freight shipments (in dollars and weight), has recently become a focal point in the supply chain. One CFO explained the difficulty companies have in balancing between these two modes of shipment in the current supply chain climate. While the CFO cited a company goal of pushing the U.S. ratio to 50:50, the company currently ships more than 90% by air and the remainder by sea from the production facility to the U.S. distribution centers to maintain inventory to meet customer demand.
Although the high level of air travel is costly, there’s no end in sight due to shipment delays. For instance, the CFO mentioned that sea travel from overseas to New York has increased from a pre-pandemic average of 60 days to 95 days, while it takes only a few weeks to get product into the United States by air. The CFO further elaborated that “to compete within a tight supply chain, we’ve had to make tough decisions to just do air travel because we need product or else we lose sales to the competitor. We have to carry some inventory.”
Third, CFOs mentioned the need to focus on their major customers and emphasized that supply chain solutions can’t be a one-size-fits-all approach. Thus, they may need to employ different shipping logistics for customers based on their order sizes, order frequency, product sizes, etc. For instance, customers that buy product in bulk at routine intervals may need a shipping logistics plan that’s in close proximity to manufacturing or product-sourcing operations.
Finally, CFOs noted that recent supply chain disruptions have been a clear lesson to balance between Just-in-Time (JIT) inventory and keeping inventory on hand. JIT inventory systems have been the goal in recent decades because they provide the benefit of reduced working capital investments in inventory. Yet companies relying on JIT have been forced to turn away customers as the supply chain became locked up in recent years. In contrast, maintaining inventory stocks ensures there’s enough supply to reduce dependence on the supply chain in the event of material shortages and shipping disruptions. One CFO we spoke with mentioned his company currently wants 90 days of supply on hand to deal with supply chain issues. Of course, this independence comes at the cost of increased working capital investments and reduced cash flow.
How can CFOs manage these consequences? This is where the CCC metric can aid decision making. As slowdowns in inventory turnover, i.e., days inventory outstanding (DIO), adversely affect the company’s ability to turn investment into cash, managing CCC places emphasis on the actions needed throughout the business to improve cash flow. For instance, to keep CCC low, increases in DIO can be offset by managing the timing of receivables and payables—through supply chain finance arrangements or by negotiating faster collections and prolonged payments.
THE CFO AS INTEGRATOR
Recent supply chain disruptions have impacted both the top line and the bottom line—not only have materials shortages slowed production and sales to customers, but rising production and distribution costs have threatened profitability. Thus, challenges in the supply chain affect manufacturing/operations, marketing/sales, and administrative/support functions. Such vulnerabilities have placed a spotlight on the CFO to help navigate these challenges with actionable solutions.
The 2022 report Supply Chains: A Finance Professional’s Perspective, from IMA, the Association of Chartered Certified Accountants (ACCA), and the Chartered Institute of Procurement & Supply (CIPS), described the role of the finance business partner. It noted that the need for the CFO to work as a collaborative business partner is even more urgent in a disrupted supply chain as operational managers need data to drive deeper insight and support decision making.
As integrators touching all business functions, CFOs work collaboratively as a hub across the entity. This requires a deep understanding of the commercial business model, the strategy, and the execution issues. One CFO we spoke with summarized it well, stating, “We work as business partners from quote to cash in the business,” helping align business processes from manufacturing through sale to ultimate collection.
Applying the CCC metric as an example, the CFO can work with (1) the sales/marketing team and the treasury department to improve days sales outstanding (DSO) by helping to negotiate customer payment terms; (2) the manufacturing/operations team and sales/marketing team to improve DIO by helping to speed production, distribution, and sales; and (3) the purchasing department to extend days payable outstanding (DPO) by negotiating favorable terms with vendors.
The CFO’s role as business integrator also comes to the forefront with forecasts and outlooks. The CFOs we spoke with all mentioned the need for even better forecast accuracy, which requires the CFO to talk to both the sales and production functions to avoid “ripple” effects in the business.
One way for CFOs to alleviate the supply chain bottleneck is to focus on next quarter’s sales so product managers and operations teams can meet demand with more precision. But short-term forecasting isn’t enough. Long-term forecasting has required CFOs to work across business functions in understanding the life cycle of the product, especially for newer products where managers have less experience to bank on. For instance, one CFO explained that longer-term forecasts enable the factory to know what parts and materials to have on hand for continuous production.
THE USE OF ANALYTICS
As companies turn to finance for answers to critical questions, CFOs recognize their leadership role in using analytics to integrate data across various business functions. Analytics help finance professionals transform data into information and actionable knowledge for decision making, and accounting and finance professionals are expected to partner in decision making and provide financial expertise to help formulate and implement an organization’s strategy.
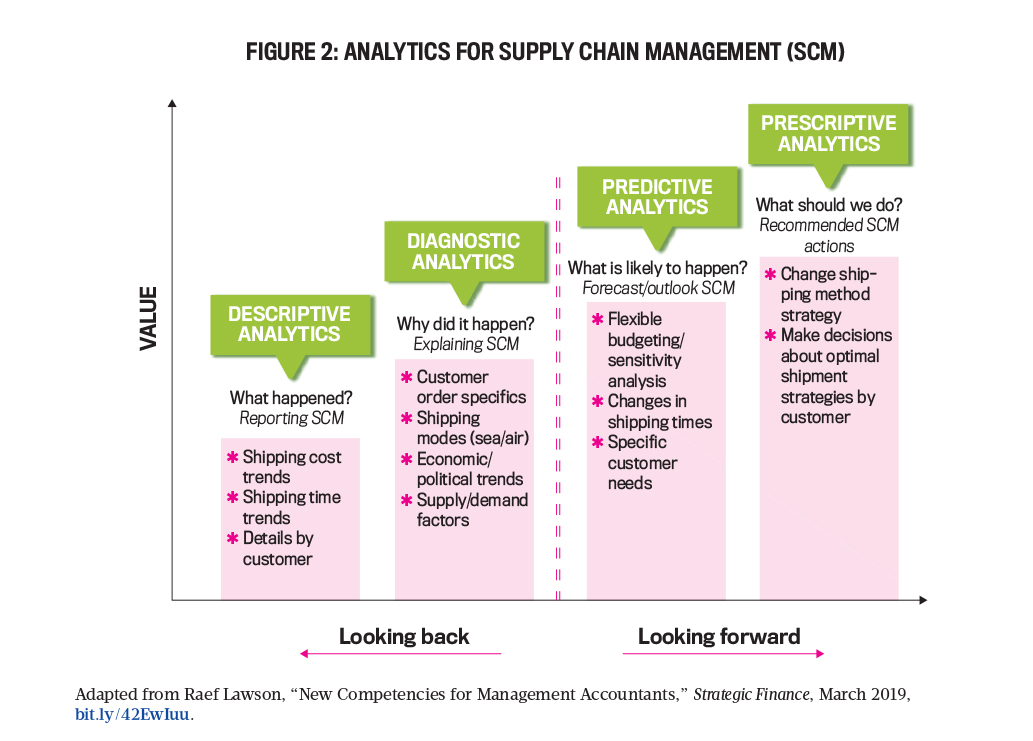
Figure 2 considers the four types of analytics and how CFOs can add value to the entity by using historical information to embrace a forward-looking mindset when tackling supply chain issues. Consider an example where a U.S. company makes its product outside the country and must decide how to deliver goods to customers. The CFO must partner in decision making to provide solutions about the company’s shipping logistics operations to its customers. The goal is to provide timely delivery at the lowest total shipping cost in a landscape where increased shipping costs and shipping delays are major considerations.
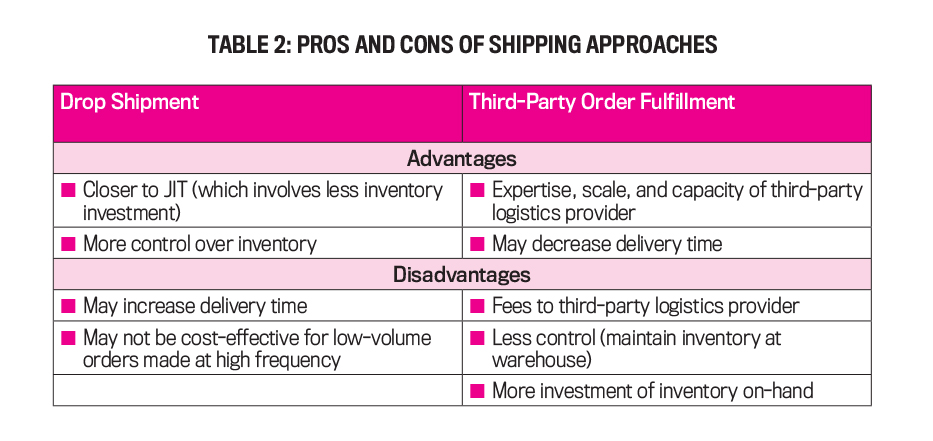
There are two shipping methods to consider. One option is to send the goods via drop shipment. In this scenario, the goods are produced at a non-U.S. manufacturing plant and then immediately packed and shipped straight to the customer in the U.S. The second option is using a third-party order fulfillment company based in the U.S. Here, the company contracts with a third-party logistics provider and perhaps a separate carrier. A stock of inventory is delivered to the logistics provider, which warehouses the goods, packages them for shipment, and manages the inventory. When a customer places an order, the company notifies the logistics provider, which draws the goods, packs them, and ships them to the customer. Table 2 highlights the advantages and disadvantages of both approaches.
With access to financial and cost information as well as the general ledger, the finance team is uniquely positioned to explain what happened through descriptive analytics of the supply chain. This is where Big Data skills come in handy for CFOs to maneuver through large volumes of transaction-level shipping data to create information. Analytics could include such measures as actual shipping costs and shipping days per transaction and per customer for each shipping method to examine shipping efficiency.
This descriptive information aids diagnostic analytics to explain why there are differences in cost and timing for the two shipment methods. Qualitative considerations for examining differences could include customer order specifics (e.g., order size, product type), fixed vs. variable costs, supply/demand trends, and political risk factors.
Examining the past with such quantitative and qualitative analytics opens the potential to look forward with predictive and prescriptive analytics. Predictive analytics allows the CFO to formulate an outlook for the supply chain of what’s likely to happen in future periods to provide actionable knowledge for decision making. For instance, the finance team can create flexible budgets with sensitivity analysis about changes in customer order volumes, shipping rates, etc. Such analytics can also consider potential changes in cost structure and shipping time for each shipping method (e.g., drop shipment vs. third-party logistics).
Finance professionals can integrate descriptive, diagnostic, and predictive analytics to develop prescriptive analytics. In a supply chain context, CFOs can use the actual shipping cost and timing information, specifics from customer orders, and the predictive output from the sensitivity analysis to make decisions about the best shipping method to use for each customer. These decisions can be communicated internally and externally by explaining the financial impact on revenues, profits, and KPIs to show investors how operational cause equals financial effect. Customer-specific metrics can also be discussed to address the likelihood of positive impacts on demand and customer satisfaction.
A CASE IN POINT
To illustrate, let’s take a look at a real-world business example. All amounts and names have been changed for confidentiality, but the relative magnitude of amounts is representative of the actual situation.
XYZ Corporation is a company with production occurring at the manufacturing facilities of its former parent company in Asia. In early summer 2021, the board of directors recognized potential supply chain issues with meeting the demands of its large customer base in North America. In response, the board commissioned XYZ’s finance function to employ cost data for transactions occurring during the fiscal year to analyze the shipping cost structure for its top 50 customers in North America. The primary objective was for the CFO organization to use financial analytics to make recommendations for each customer about whether to ship products through drop shipments from Asia or through a third-party logistics company in North America. As it turned out, the XYZ board was ahead of the curve on the impending supply chain issues that rose to the surface later that year.
The situation. The situation facing XYZ’s finance team was similar to the analytics scenario described earlier. The business was using drop shipments from the manufacturing facility in Asia. In addition, XYZ had recently begun a third-party logistics program with 3PL Co., a North American logistics vendor, to speed order fulfillment for certain transactions with some of its top 50 customers. 3PL ran a very organized process where goods were first placed on pallets for storage by warehouse personnel upon inbound receipt from Asia. Later, upon sales notice from XYZ, the warehouse personnel picked the goods out of storage to prepare the customer order. Finally, the goods were packed in boxes and shipped to the customer.
Descriptive analytics. The finance team combed through a large database of thousands of transactions by month and by customer to explain the cost structure of each shipping method. Recognizing the variation in sizes of deliveries and packages, the finance and operations teams jointly decided to focus on total costs per piece delivered for final decision making, as this was the smallest unit of measurement for shipments.
The analysis revealed that drop shipments from Asia averaged $6.50 per piece delivered. Because this came directly from the former parent company’s main operational facility that was already running production and shipments for other parts of the business, there was no opportunity for reducing unit shipping costs (although XYZ wasn’t contractually bound to use the facility).
The team expected 3PL’s cost structure to be much higher since its process was much more elaborate and labor-intensive. Yet the descriptive analysis showed that 3PL’s total cost per piece was $6.60—higher than drop shipments but reasonably within 2%. This cost included 3PL’s fixed costs for running the program and maintaining the warehouse capacity plus the variable cost associated with storing goods, picking goods from inventory, and shipping goods from the warehouse to customers.
Diagnostic analytics. Given this surprising cost differential, XYZ team members dug into the data to diagnose the cost structures a bit more. With little leeway to change the drop shipment costs, they focused on the 3PL cost structure, excluding fixed costs to examine the variable costs associated with 3PL’s direct activities. Total variable costs per piece delivered were only $2.40, or 63% less than the drop shipment cost of $6.50. Thus, 3PL Co’s fixed costs per unit ($4.10 per piece, for a total cost of $6.60) were especially high, largely because XYZ had just begun the program with limited use.
When the team examined these costs by customer, the patterns were similar. This was eye-opening and raised an obvious question: Was there an opportunity to reduce the risk of disruption while still controlling expenses?
Predictive analytics. As the operations and finance teams looked to the future, the descriptive analytics showed the potential to lower XYZ’s costs by increasing the scale of operations with 3PL by shifting customers to that platform. Of course, this relied on the ability to negotiate favorable terms that would keep 3PL’s fixed cost fee structure constant. To accomplish this, 3PL would have to stay within a relevant range of activity for its operations after adding the increased inventory volume from XYZ.
Management accounting textbooks teach students that definitions of fixed and variable cost behavior are only meaningful within a short-term, normal state of operations—a relevant range. Within the short term, total fixed costs are constant. In the long run (outside the relevant range), however, all costs are virtually variable. Indeed, in the well-known book, Relevance Lost, authors H. Thomas Johnson and Robert S. Kaplan state that “…many costs, which appear to be fixed over relatively short periods, are variable with respect to longer decision horizons.”
Thus, XYZ’s decision rested on whether 3PL had excess capacity at its warehouse to accommodate the additional demand so that 3PL stayed within its normal range of activity and its total fixed costs remained constant. This would be a win-win, as 3PL would generate marginal variable revenue from the increased volume and XYZ would only incur the marginal variable cost from 3PL’s inventory handling.
In contrast, expanding capacity (e.g., adding a warehouse) would push 3PL outside its relevant range of activity, which would render its fixed cost structure now variable to XYZ’s additional demand. As the descriptive analytics already highlighted, this would significantly raise XYZ’s total shipping cost per piece.
Prescriptive analytics. As good fortune would have it, 3PL had the needed excess capacity and was willing to take on the additional inventory without a change in its fixed cost program fees. For XYZ, the decision boiled down to marginal variable costs per piece. Because fixed costs per unit decrease with activity, increases in 3PL shipments would drive the total cost per piece down from $6.60 per piece toward the $2.40 variable cost level—as compared to the total cost of $6.50 per piece for drop shipments. This 63% cost difference was a no-brainer for XYZ.
The XYZ team also examined the same scenario for each customer and found similar cost dynamics. Thus, at the end of summer 2021, XYZ swiftly made the decision to cease drop shipments from Asia for all North American customers (except when large orders made it more time-efficient and cost-effective to drop-ship directly from Asia). This decision was made in the nick of time—the supply chain disruption worsened significantly in the ensuing months.
PRACTICAL GUIDANCE FOR CFOs
Our discussions with CFOs reveal that they recognize the importance of integrating more data analytics into their financial analysis with KPIs that are relevant to managing the supply chain. But they also see the need to engage as strategic integrators with their business partners to align business processes between key functions of the organization that surround the supply chain. Moreover, these CFOs point out that being strategic leaders requires them to strive for more precision with a longer-term perspective to prepare against the next business risk—whether it be in the supply chain or somewhere yet to be seen.
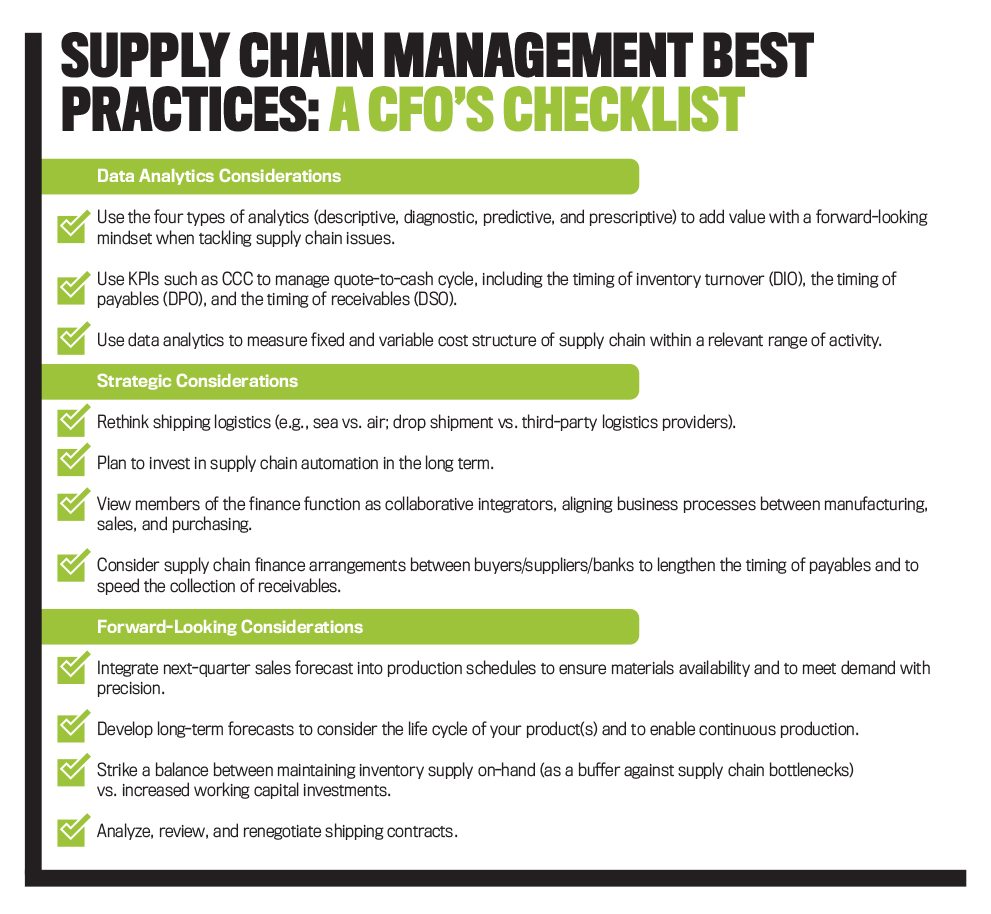
Combining these insights and the outcomes from an actual business situation, “Supply Chain Management Best Practices: A CFO’s Checklist” summarizes best practices for supply chain management in the CFO’s checklist. The framework it provides for using analytics in the supply chain can help CFOs and their teams extract information from their historical data toward a forward-looking view to reinforce their role as collaborative integrators.

June 2023


